
In the dynamic and often volatile world of digital assets, traders and investors rely on a suite of tools and indicators to navigate the market. Among the most fundamental yet powerful of these is cryptocurrency trading volume. While price charts and market capitalization often steal the spotlight, volume provides a crucial layer of context, revealing the conviction and momentum behind price movements. It acts as the engine of the market, and understanding its rhythm is essential for anyone looking to make informed decisions.
Trading volume is, in its simplest form, a measure of activity. It quantifies the total amount of a specific cryptocurrency that has been bought and sold over a set period, typically 24 hours. This data tells a story about market participation and interest. Is a price rally backed by a surge of enthusiastic buyers, or is it a fragile move on thin trading that could easily collapse? Is a market crash driven by widespread panic, or is it a minor dip with little selling pressure? The answers to these questions are often found by analyzing the volume bars that accompany every price chart.
Ignoring volume is like watching a movie on mute; you can see what’s happening, but you miss the crucial audio cues that provide depth and meaning. It helps traders distinguish between strong, sustainable trends and weak, temporary fluctuations. By learning to interpret the relationship between price and volume, you can gain a significant edge, better identify entry and exit points, and avoid common trading pitfalls.
This article will serve as your guide to decoding this essential metric. We will explore what trading volume is, why it is critically important for market analysis, and how you can use it to confirm trends and spot potential reversals. We will also delve into the darker side of this metric—the issue of fake volume and wash trading—and equip you with the knowledge to differentiate genuine market activity from manufactured hype. By the end, you’ll have a comprehensive understanding of how to use trading volume to enhance your trading strategy.
What Exactly is Cryptocurrency Trading Volume?
At its core, cryptocurrency trading volume represents the total number of coins or tokens that have changed hands on an exchange or across the entire market within a specific timeframe. It’s a fundamental measure of the overall activity and liquidity for a particular digital asset. Think of it as the market’s pulse; a higher volume indicates more activity and interest, while a lower volume suggests less activity and waning interest.
This metric is typically presented in two primary ways:
- In the Native Cryptocurrency: This shows the total quantity of the coin itself that was traded. For example, the 24-hour volume for Bitcoin might be reported as 50,000 BTC. This is useful for understanding the raw amount of the asset being moved.
- In a Quote Currency: This shows the total monetary value of the trades, usually expressed in a fiat currency like the US Dollar (USD) or a stablecoin like Tether (USDT). For instance, the same 50,000 BTC volume would be reported as approximately $3.5 billion if Bitcoin’s price were $70,000. This is the most common way volume is reported as it makes it easier to compare the market activity of different assets.
It’s also important to distinguish between the volume on a single exchange and the aggregate volume across the entire market. A single exchange, like Binance or Coinbase, will report the volume for pairs traded on its platform (e.g., BTC/USD). However, data aggregators like CoinMarketCap and CoinGecko compile data from hundreds of exchanges to provide a global, aggregate trading volume, giving a more complete picture of the market’s overall activity for a given cryptocurrency.
The Critical Role of Trading Volume in Market Analysis
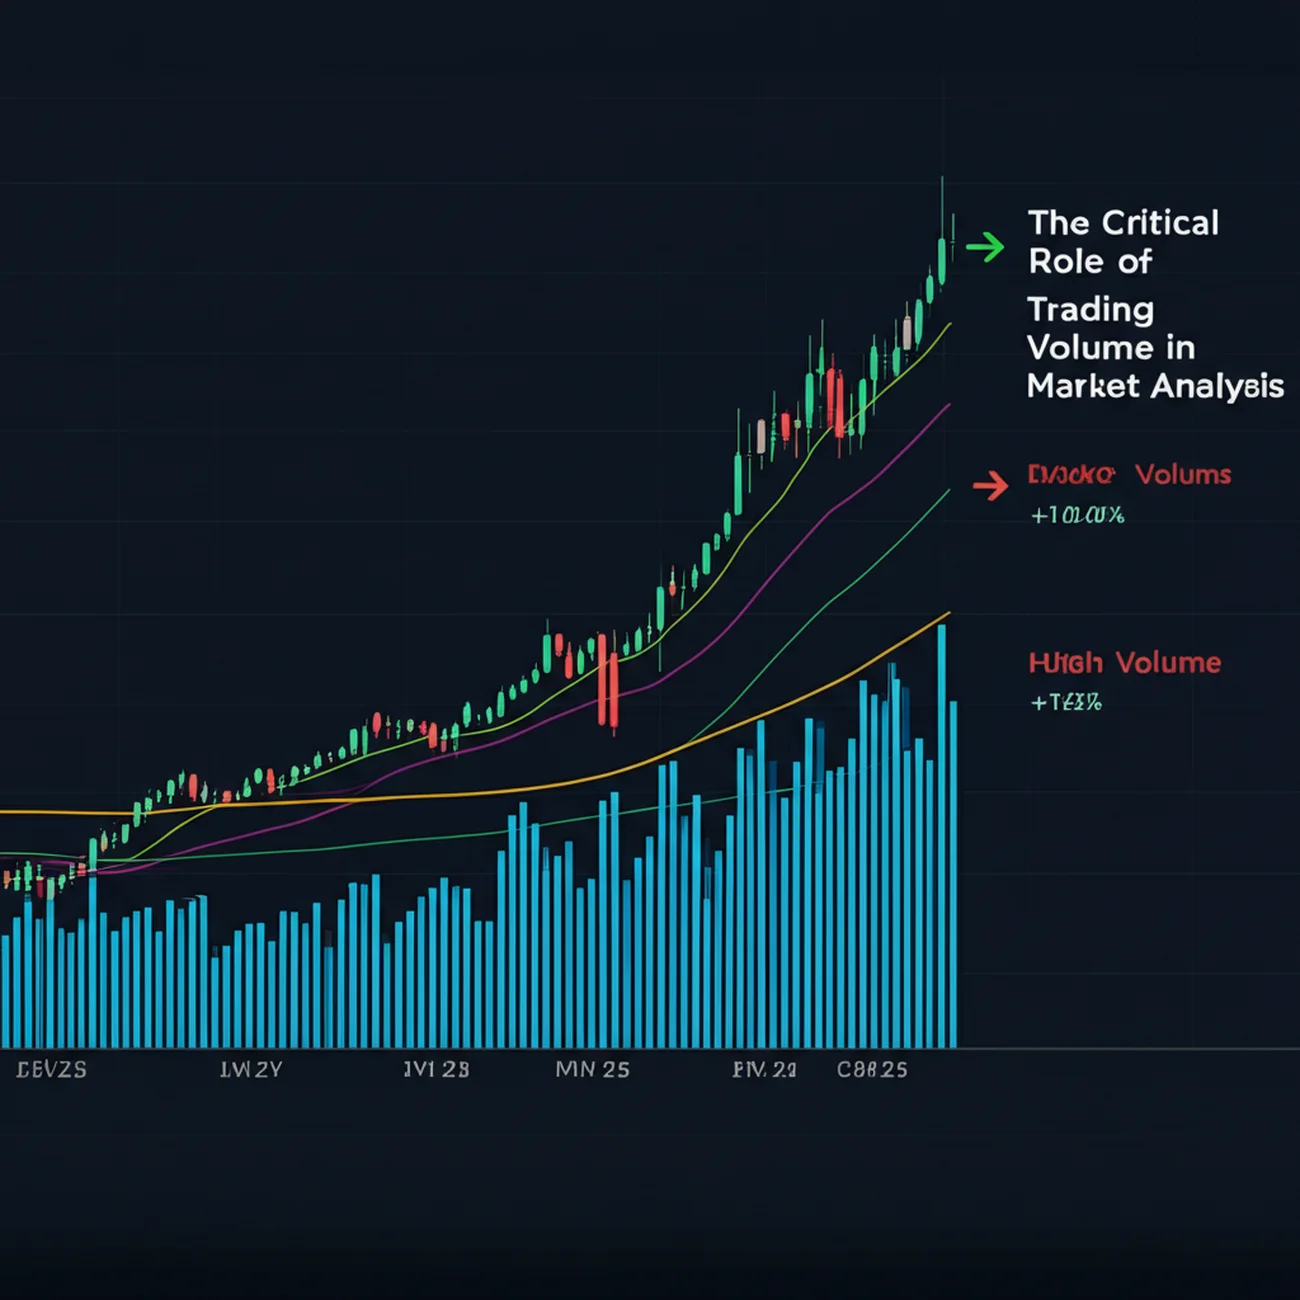
Trading volume is far more than a simple statistic; it’s a powerful analytical tool that provides deep insights into market sentiment and the strength of price movements. Professional traders rarely make a decision based on price alone because volume provides the essential confirmation they need.
Confirming Trend Strength
The relationship between price and volume is a cornerstone of technical analysis. It helps traders gauge the health and sustainability of a market trend.
- Healthy Uptrend: When prices are rising and are accompanied by high or increasing trading volume, it signals strong buying interest and widespread participation. This suggests the uptrend is healthy and has the momentum to continue. Conversely, if the price is rising but volume is declining, it can be a red flag, indicating that conviction is waning and the trend may be running out of steam.
- Healthy Downtrend: When prices are falling on high trading volume, it indicates significant selling pressure and a strong consensus that the price should be lower. This confirms the strength of the downtrend. However, if the price is falling on very low volume, it suggests a lack of selling conviction, and the trend might be nearing its end or ready for a reversal.
Gauging Liquidity and Market Interest
Liquidity refers to the ease with which an asset can be bought or sold at a stable price. Trading volume is the best direct indicator of a cryptocurrency’s liquidity.
A crypto with a high trading volume is considered highly liquid. This means there are many buyers and sellers at any given time, making it easier to execute large orders without causing a dramatic price swing (an effect known as “slippage”). This is crucial for institutional investors and “whales” who need to move large amounts of capital.
On the other hand, a crypto with low trading volume is illiquid. Trying to buy or sell a significant amount can be difficult and may lead to high slippage, where the price you get is much worse than the price you expected. Low-volume assets are also more susceptible to price manipulation because a single large order can have an outsized impact on the price.
Spotting Potential Reversals
Volume can be an excellent early warning system for a potential trend reversal. Traders look for specific patterns to anticipate a change in market direction.
- Exhaustion Moves: Sometimes, a long-running trend will end with a final, dramatic price move accompanied by a massive spike in volume. In an uptrend, this is called a blow-off top. It often signals that the last of the retail buyers have rushed in (FOMO), and smart money is beginning to sell into that strength. This surge in volume can mark the peak just before a sharp reversal.
- Volume Divergence: Divergence occurs when the price and volume are telling different stories. A bearish divergence happens when the price reaches a new high, but the volume on that move is lower than the volume on the previous high. This lack of confirmation from volume suggests the trend is weak and a reversal could be imminent. Conversely, a bullish divergence occurs when the price hits a new low on lower volume, indicating that selling pressure is drying up and the downtrend may be over.
How to Analyze Cryptocurrency Trading Volume Effectively
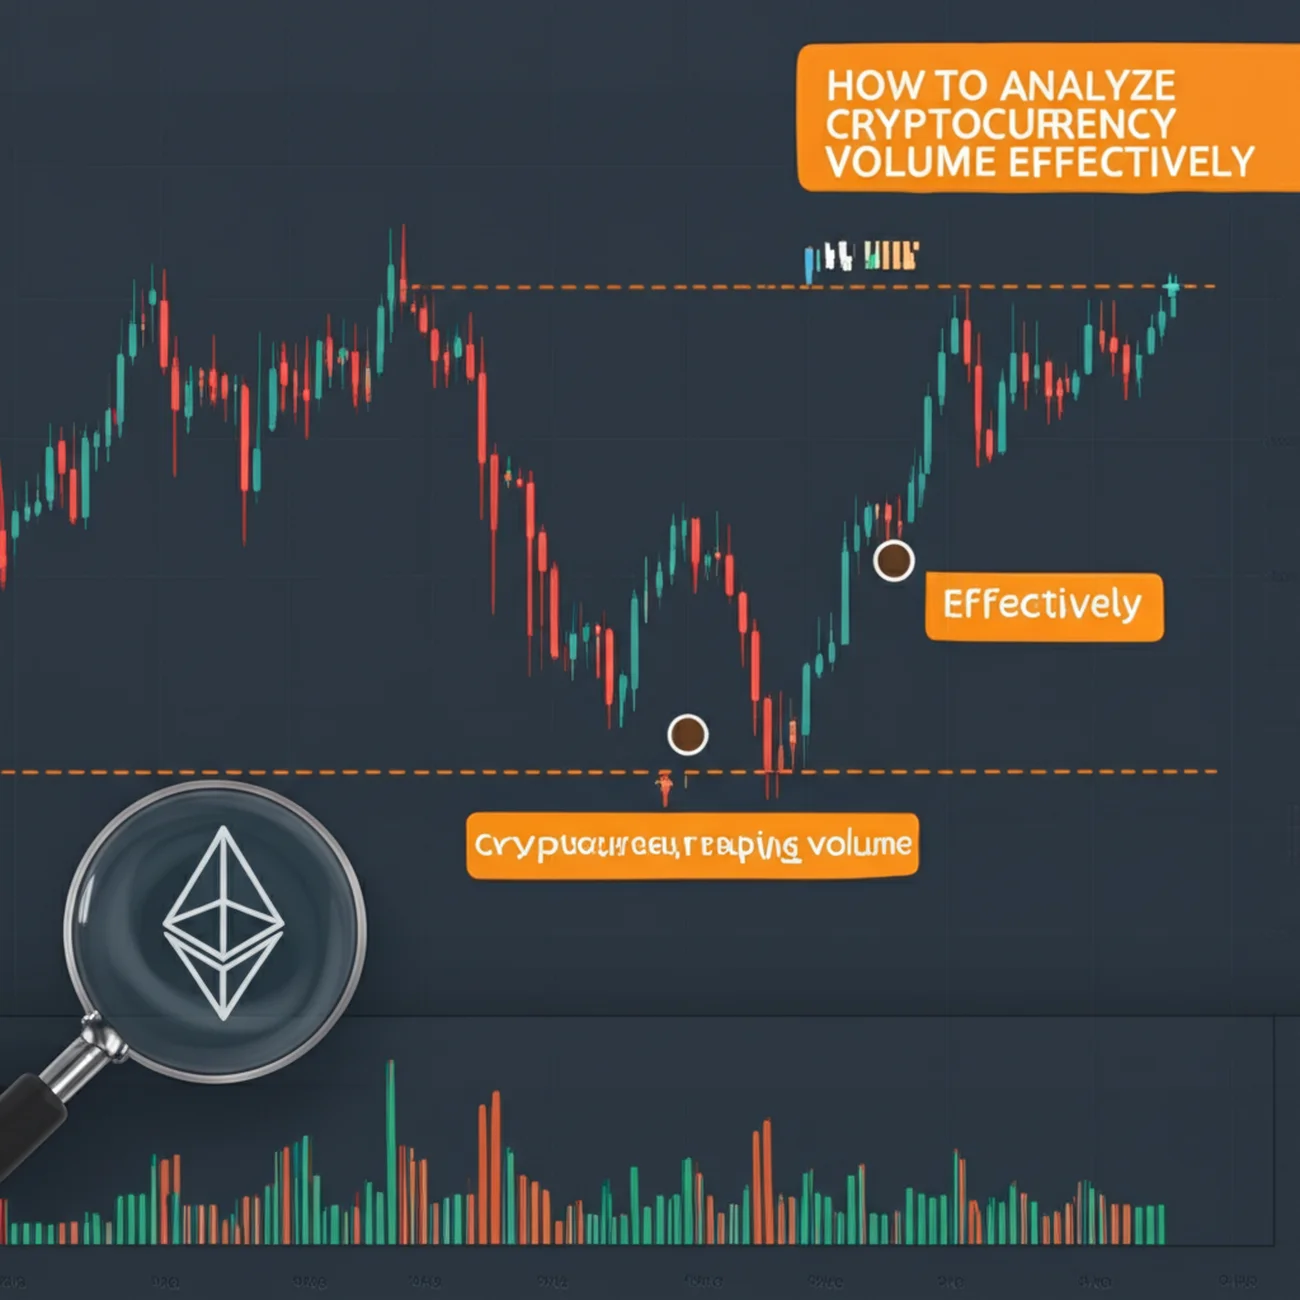
Understanding the theory behind volume is one thing; applying it practically is another. Most trading platforms and charting tools provide several ways to visualize and analyze volume data, from simple bar charts to more complex indicators.
Reading Volume on Charts
The most common way to view volume is through the bar chart displayed at the bottom of a price chart. Each bar represents the total volume traded during that period (e.g., one hour, one day).
- Color Coding: These bars are typically color-coded. A green bar indicates that the price closed higher than it opened for that period, while a red bar means it closed lower.
- Moving Averages: To better gauge whether the current volume is high or low, traders often add a moving average line to the volume chart (e.g., a 20-period or 50-period MA). When a volume bar shoots up well above this average line, it signals a period of unusually high activity that warrants closer attention.
On-Balance Volume (OBV)
The On-Balance Volume (OBV) indicator is a momentum tool that uses volume flow to predict price changes. It’s a running total of volume that adds volume on up-days and subtracts it on down-days.
The core idea behind OBV is that volume precedes price. If OBV is rising, it suggests that volume is flowing into the asset, which can foreshadow a price increase. If OBV is falling, it indicates volume is flowing out, potentially preceding a price drop. Traders look for OBV to confirm the price trend or to spot divergences. For instance, if the price is making new highs but the OBV is failing to do so, it’s a bearish signal.
Volume Profile
For a more advanced view, traders use the Volume Profile indicator. Unlike the traditional volume-over-time chart at the bottom, Volume Profile displays trading activity over price levels on a vertical axis. It shows you exactly which price points have attracted the most and least trading activity.
- Point of Control (POC): This is the single price level with the highest traded volume, appearing as the longest bar on the profile. The POC often acts as a strong magnet for price, functioning as powerful support or resistance.
- Value Area (VA): This is the price range where a significant percentage (typically 70%) of the total volume was traded. Trading outside the value area can signal the beginning of a new trend.
The Pitfalls of Volume Analysis: Wash Trading and Fake Volume
While analyzing cryptocurrency trading volume is a powerful technique, it comes with a significant caveat: not all volume is real. The largely unregulated nature of many crypto exchanges has led to the widespread problem of wash trading and fake volume.
Wash trading is a form of market manipulation where a trader or an exchange simultaneously buys and sells the same asset to create a false impression of high market activity. Unscrupulous exchanges engage in this practice for several reasons:
- To Attract Users: A new exchange can inflate its volume numbers to appear more popular and liquid than it actually is, attracting legitimate traders and their fees.
- To List on Aggregators: High trading volume is often a prerequisite for being listed on major data aggregators like CoinMarketCap, which brings visibility and legitimacy.
- To Manipulate Prices: Concentrated wash trading can be used to manipulate the price of a low-liquidity asset.
Numerous studies have revealed that a substantial portion of the reported crypto trading volume, particularly on smaller and unregulated exchanges, may be artificial. This can mislead traders who rely on volume data to make decisions. To protect yourself, it’s crucial to be skeptical. Use reputable exchanges with a long track record and strong regulatory oversight. Additionally, many data providers now offer “Adjusted Volume” metrics, which attempt to filter out exchanges with suspicious trading patterns, providing a more realistic view of market activity.
Comparing Trading Volume Across Different Cryptocurrencies
When analyzing volume, context is everything. Simply saying a coin has a “high” or “low” volume is meaningless without a point of comparison.
- Bitcoin vs. Altcoins: Bitcoin and Ethereum consistently dominate trading volume rankings. It’s unrealistic and unhelpful to compare the absolute 24-hour volume of a small-cap altcoin to that of Bitcoin. Bitcoin’s volume reflects its status as the market’s primary reserve asset and most liquid trading instrument.
- Relative Volume (RVOL): A far more insightful approach is to analyze a coin’s relative volume. This compares its current trading volume to its own historical average (e.g., the last 30 or 90 days). A coin trading at 3x or 5x its average daily volume is experiencing a significant event—perhaps due to a news announcement, a major partnership, or a shift in market sentiment. This spike in relative volume is a powerful signal that something important is happening.
- The Role of Stablecoins: When looking at overall market volume, you’ll notice that stablecoins like USDT and USDC often have astronomical trading volumes, sometimes even surpassing Bitcoin’s. This is because they serve as the lifeblood of the crypto trading ecosystem. They are the primary unit of account and medium of exchange on most platforms, used to move in and out of positions in other cryptocurrencies. High stablecoin volume is often a sign of a healthy, active, and liquid market.
Conclusion
Cryptocurrency trading volume is an indispensable tool in any trader’s arsenal. It provides the crucial context that price action alone cannot convey, offering a window into the market’s true sentiment, conviction, and participation. By mastering the art of reading volume, you can learn to distinguish between strong, healthy trends and weak, deceptive ones.
From confirming the strength of a breakout to spotting the subtle signs of an impending reversal, volume analysis elevates your trading from simple guesswork to a more strategic and informed practice. It helps you understand market liquidity, avoid illiquid traps, and identify where the real interest and capital are flowing.
However, it’s equally important to remain vigilant about the potential for manipulation through wash trading and fake volume. Always prioritize data from reputable exchanges and use trusted analytics platforms that work to provide a clear and accurate picture of the market. Ultimately, by integrating a disciplined analysis of trading volume into your strategy, you take a significant step toward navigating the complexities of the cryptocurrency market with greater confidence and skill.
